Licensed CC-BY-NC.
Mass extinctions are profound events in the history of life that dramatically affect global ecosystems. Our understanding of these events is based on the fossil record, and can help us to understand the ecological impacts of extinction, as well as what caused them. Gaining insight into mass extinctions in the past is becoming increasingly important as we are now well into the sixth mass extinction, thanks to the global damage that humans are causing.
Not all mass extinctions were the same. Of the five known from the fossil record, the number of species that went extinct, and the subsequent impact this had on different ecosystems, varied massively. This is because different modes of extinction have different disruptive effects on the organisation, and subsequent reorganisation, of ecosystems. For example, the Late Ordovician crisis around 450 million years ago documents one of the most severe losses of life overall, but with limited ecological consequences based on the distribution of those extinctions. On the other hand, we have the end-Cretaceous mass extinction, which was comparatively less severe based on the number of species lost, but led to a global reorganisation of animal groups as some major ones (like dinosaurs) went extinct, while others took advantage of this and diversified (like mammals).

A new study by Andrew Krug and Mark Patzkowsky from Penn State University, and published in the open access journal PLOS ONE, sheds some light on this variety by investigating how the relatedness of species affects their disposition to extinction. This is significant for investigations of modern extinction, as we might expect external factors, such as climate change, to impact more similarly upon more closely related species. Evolutionary relatedness can be measured fairly simply as the amount of evolution that has happened between two species since they diverged, based on the lengths of their branches in an evolutionary tree.
The reason why this is important, is because if an extinction is shown to be phylogenetically selective, or clustered in similar species, then this can explain why a greater portion of evolutionary history or relatedness disappears. This then provides a mechanism for why we sometimes see disconnect between the magnitude of an extinction and the ecological severity of it.
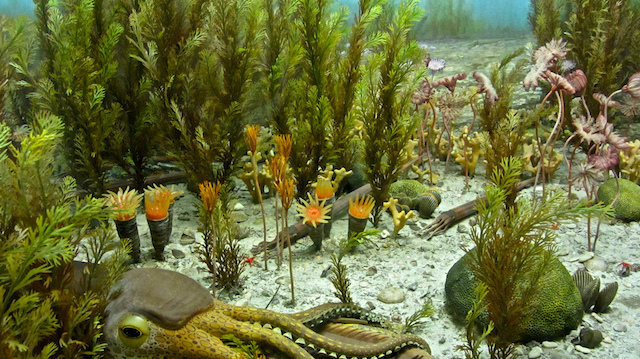
Krug and Patzkowsky decided to look at brachiopods, small shelly invertebrates, from a period spanning the Middle Ordovician to the end of the Devonian, an interval which includes the Late Ordovician mass extinction. What they found was pretty unusual, and pretty cool from an evolutionary perspective.

In the Ordovician, both speciation and extinction rates of families of brachiopods are almost entirely random, meaning that there is little evolutionary or phylogenetic selectivity. However, in the Silurian and Devonian, these shift to being strongly clustered, implying that extinction was highly selected for based on phylogenetic similarity. This shift appears to be associated with the timing of the beginning of the recovery period following the Late Ordovician mass extinction. During the mass extinction itself, brachiopod extinction was only weakly clustered, suggesting that there was little selectivity acting during this event.

This means that, in this case, it’s the recovery from the Late Ordovician extinction which is responsible for major shifts in the diversification of brachiopods, rather than the extinction interval itself. The cause for such a shift remains a bit of a mystery at the present. It could be due to the geography of surviving species, which resulted in rapid diversification in new environments, or perhaps some aspect of their ecology such as body size.
These new results stand in stark contrast to other patterns in Cretaceous-Cenozoic bivalves, which show almost the exact opposite patterns. During the end-Cretaceous mass extinction, extinctions were extremely strongly clustered, far beyond the rest of the Cretaceous.
[media-credit name=”Mike Beauregard” link=”https://www.flickr.com/photos/31856336@N03/11442780273″ align=”alignnone” width=”640″] [/media-credit]
What this helps to show is that there is a complex relationship between the nature of extinction and the evolutionary relatedness of organisms, and it certainly isn’t consistent through time or between different groups. In the cases mentioned here, this lends support to the hypothesis that there is a link between higher relatedness between organisms and their sensitivity to extinction, and the ecological severity of mass extinctions.
In addition to this, species which are more closely related evolutionarily tend to also be more closely ecologically – think about wild cats as an example for this. This means that a phylogenetically sensitive extinction event will impact upon more ecologically similar organisms, based purely on the fact that they will have a similar life history. The result of this is a longer-term ecological impact of extinctions, irrespective of the relative proportion of species to become extinct.
This new study should set the groundwork for further investigations into the causes and structure of major extinction events.
The research was published in the open access journal PLOS ONE.
Source: The ecology of mass extinctions